LAUNCHED
Vehicle Autonomy and Intelligence Lab
Vehicle Autonomy and Intelligence Lab
Helping engineers make better decision with AI data from Self-Driving Racing Car
Helping engineers make better decision with AI data from Self-Driving Racing Car
MY ROLE
MY ROLE
As the Lead UI/UX Designer, I designed every part of the dashboard except the maps. I also guided a team of seven designers in conducting eight in-depth user interviews.
As the Lead UI/UX Designer, I designed every part of the dashboard except the maps. I also guided a team of seven designers in conducting eight in-depth user interviews.
TEAM
TEAM
1 UX/UI Designer, 2 Developers, 10 Engineers,
1 Product Manager
1 UX/UI Designer, 2 Developers, 10 Engineers,
1 Product Manager
IMPACT
IMPACT
Reduced interpretation time from 3.8s to 1.2 s through 6 iterations, and showcased it at the 2024 Indy Autonomous Challenge, where it was featured by CNBC.
Reduced interpretation time from 3.8s to 1.2 s through 6 iterations, and showcased it at the 2024 Indy Autonomous Challenge, where it was featured by CNBC.
TIMEFRAME
TIMEFRAME
Oct 2023 - Sep 2024
Oct 2023 - Sep 2024
Summary
Summary
The first internal dashboard that intuitively visualized complex AI data for autonomous race cars
The first internal dashboard that intuitively visualized complex AI data for autonomous race cars
3.16x
3.16x
faster data comprehension
faster data comprehension
CNBC
CNBC
featured by CNBC
featured by CNBC

Process


Context
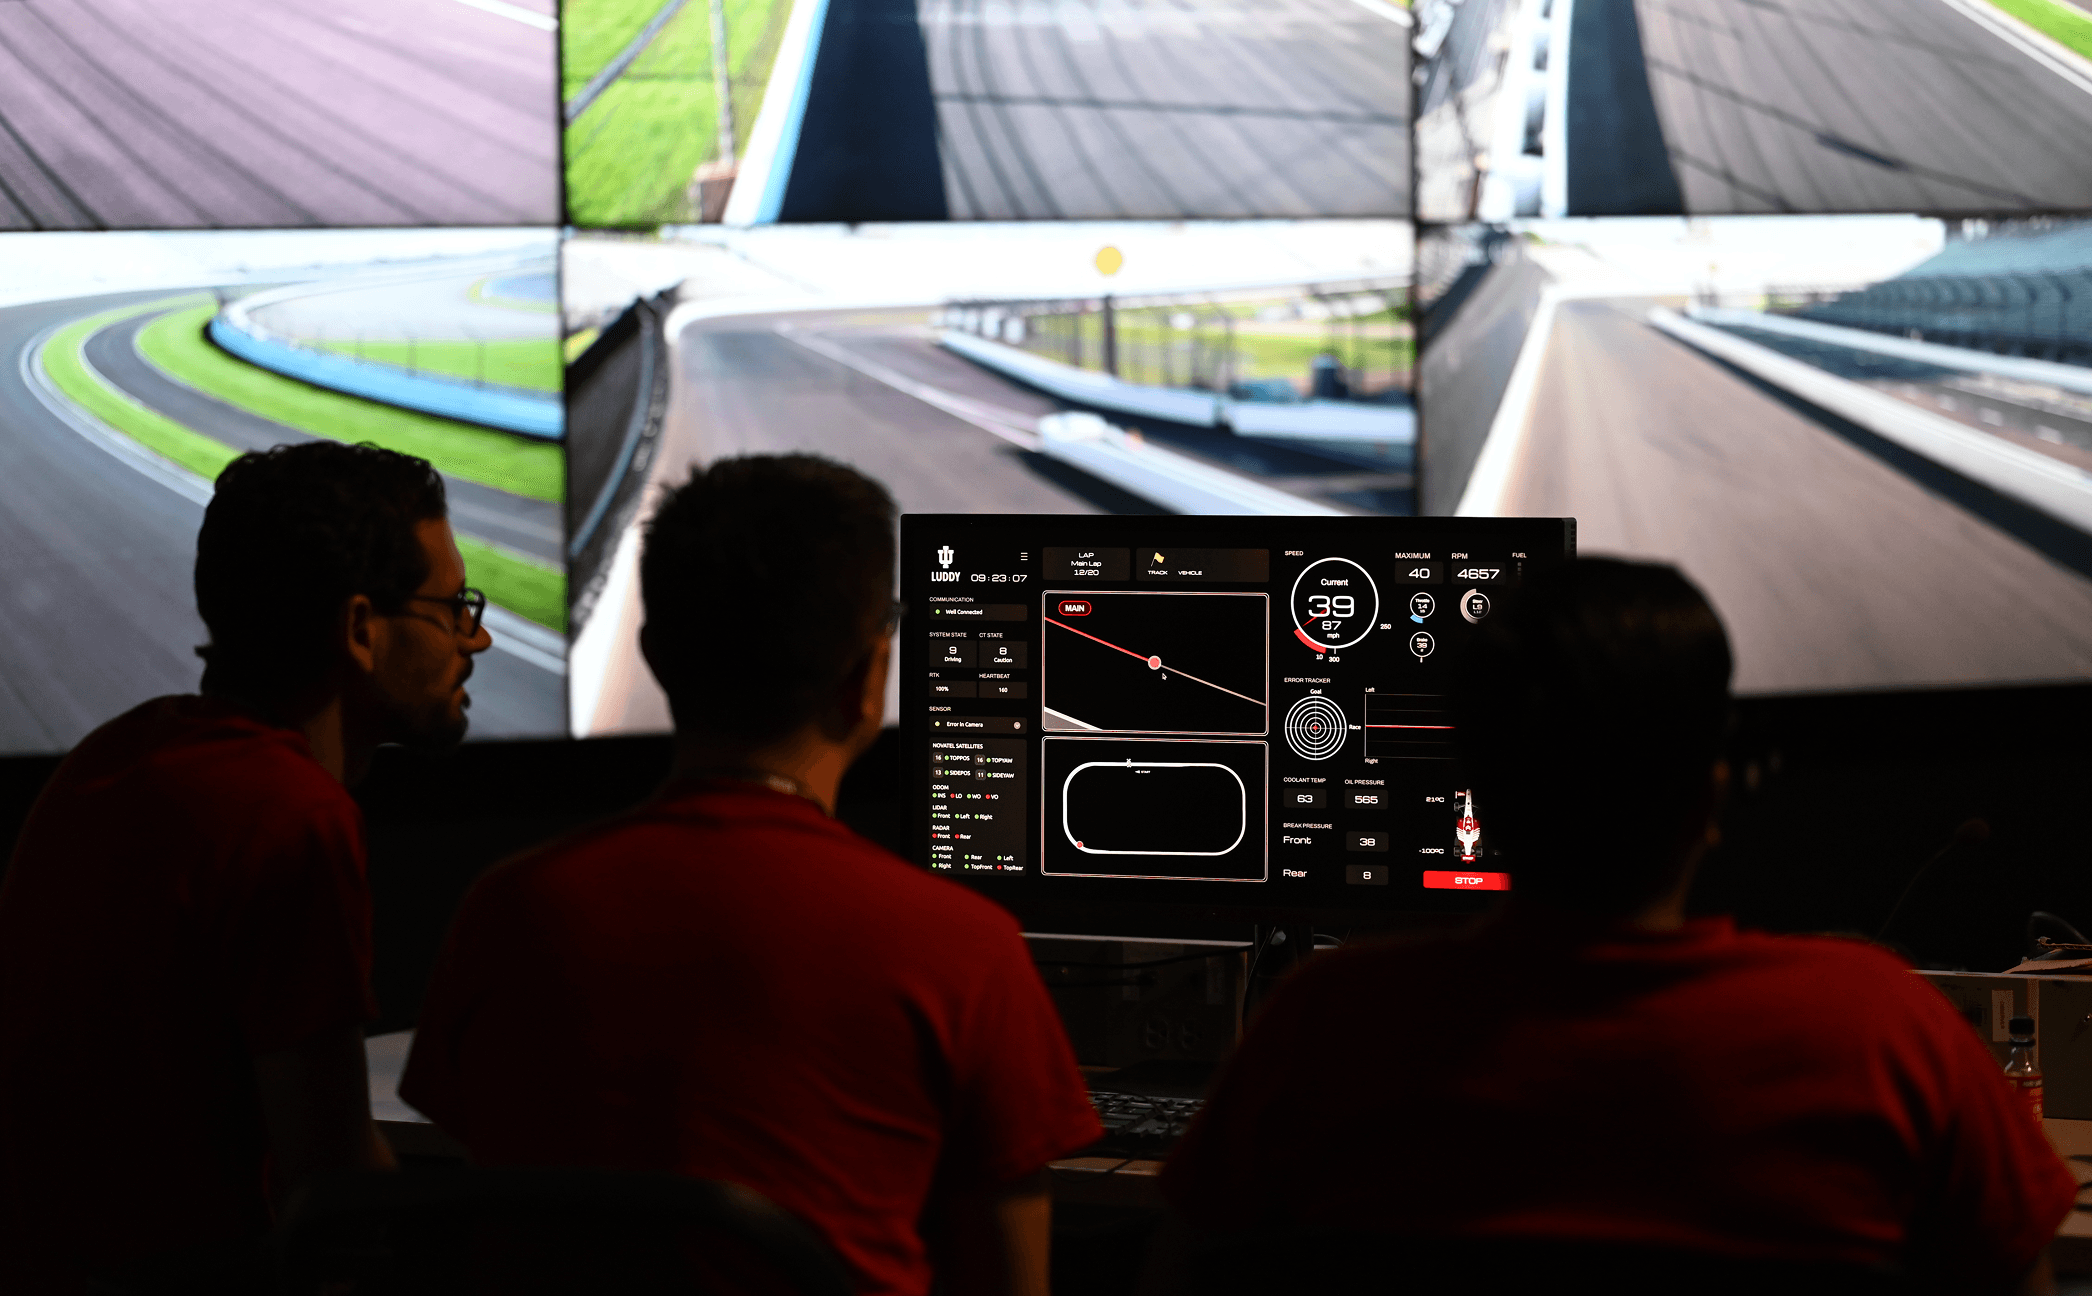
For one of the world’s first autonomous races
No driver onboard—engineers monitored AI data in real time.


An internal tool designed for AI engineers
Tailored to the specific needs of internal engineers.


User Research


In-depth Interview
To understand the meaning, priority, and context of the data.


Comparable Analysis
Researched platforms used by engineers to view data.


Heuristic Evaluation
To evaluate the effectiveness of the design.
Problem Analysis
Text-heavy data slowed interpretation


Engineers new to the tool struggled to understand data


Data
3.6 secs
3.6 secs
To locate the needed data.
Reference
1 st
No existing design precedent.
Worst Case Scenario
Delayed responses could lead to a car crash


Goal
Simplify complex AI data to help engineers quickly understand and feel assured
Iteration Summary
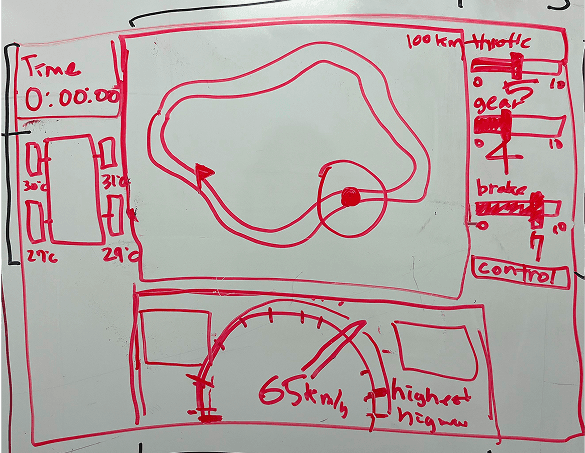

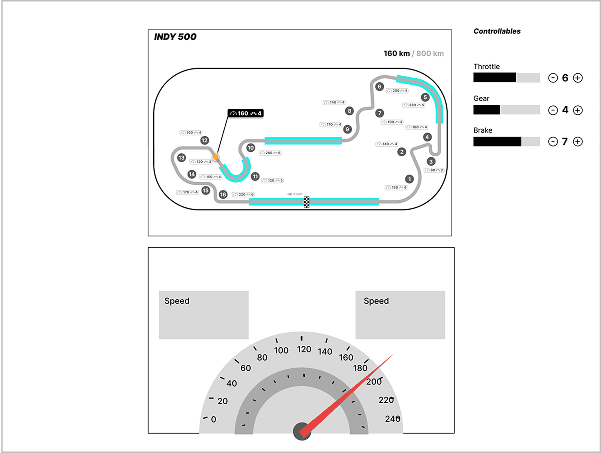

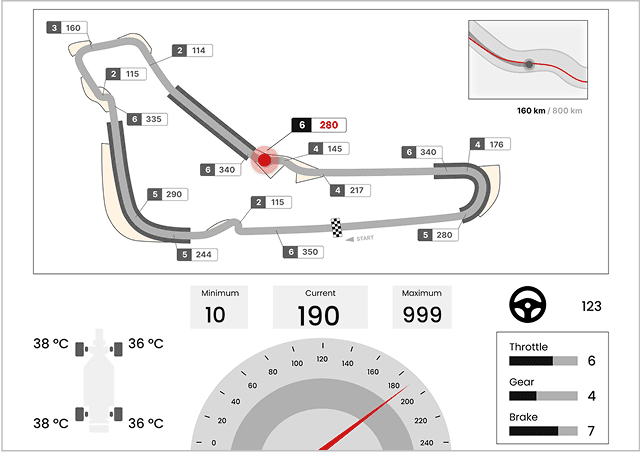

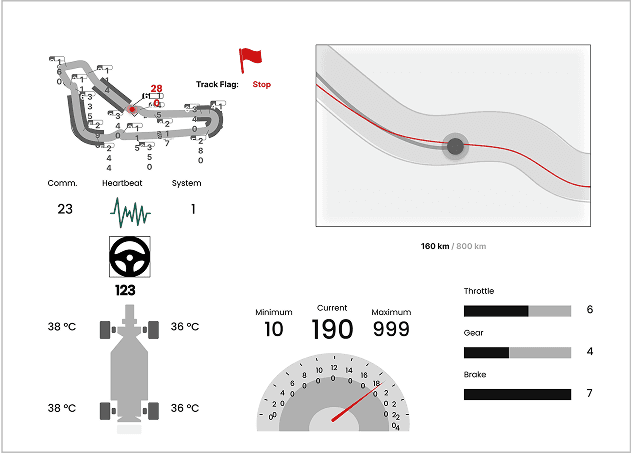

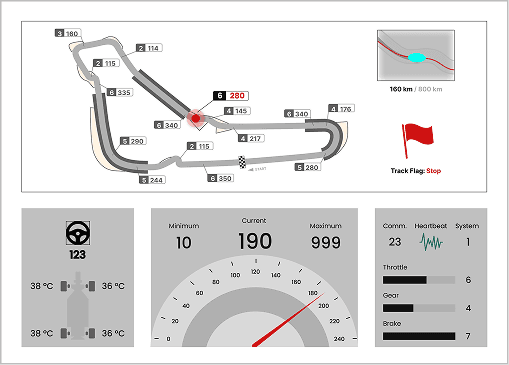

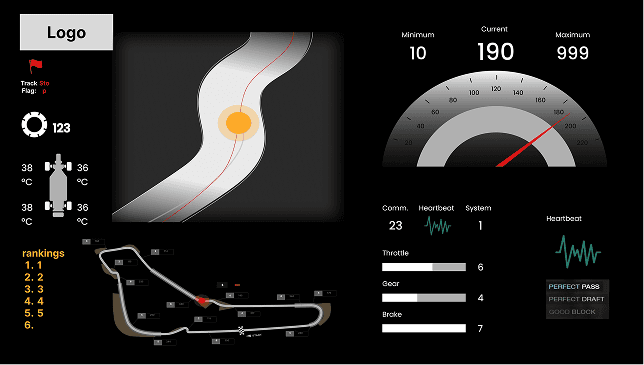

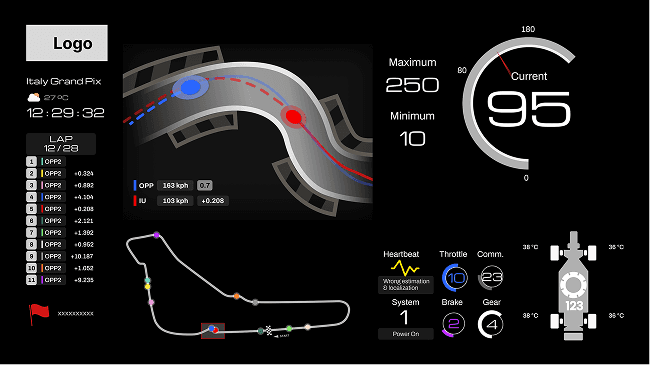

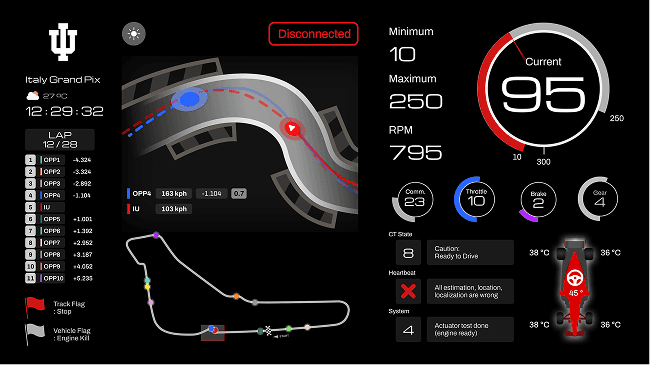

Received Feedback on Initial Versions
" It looks fancy but messy "
" I can't immediately understand data from graphs "
Iterations
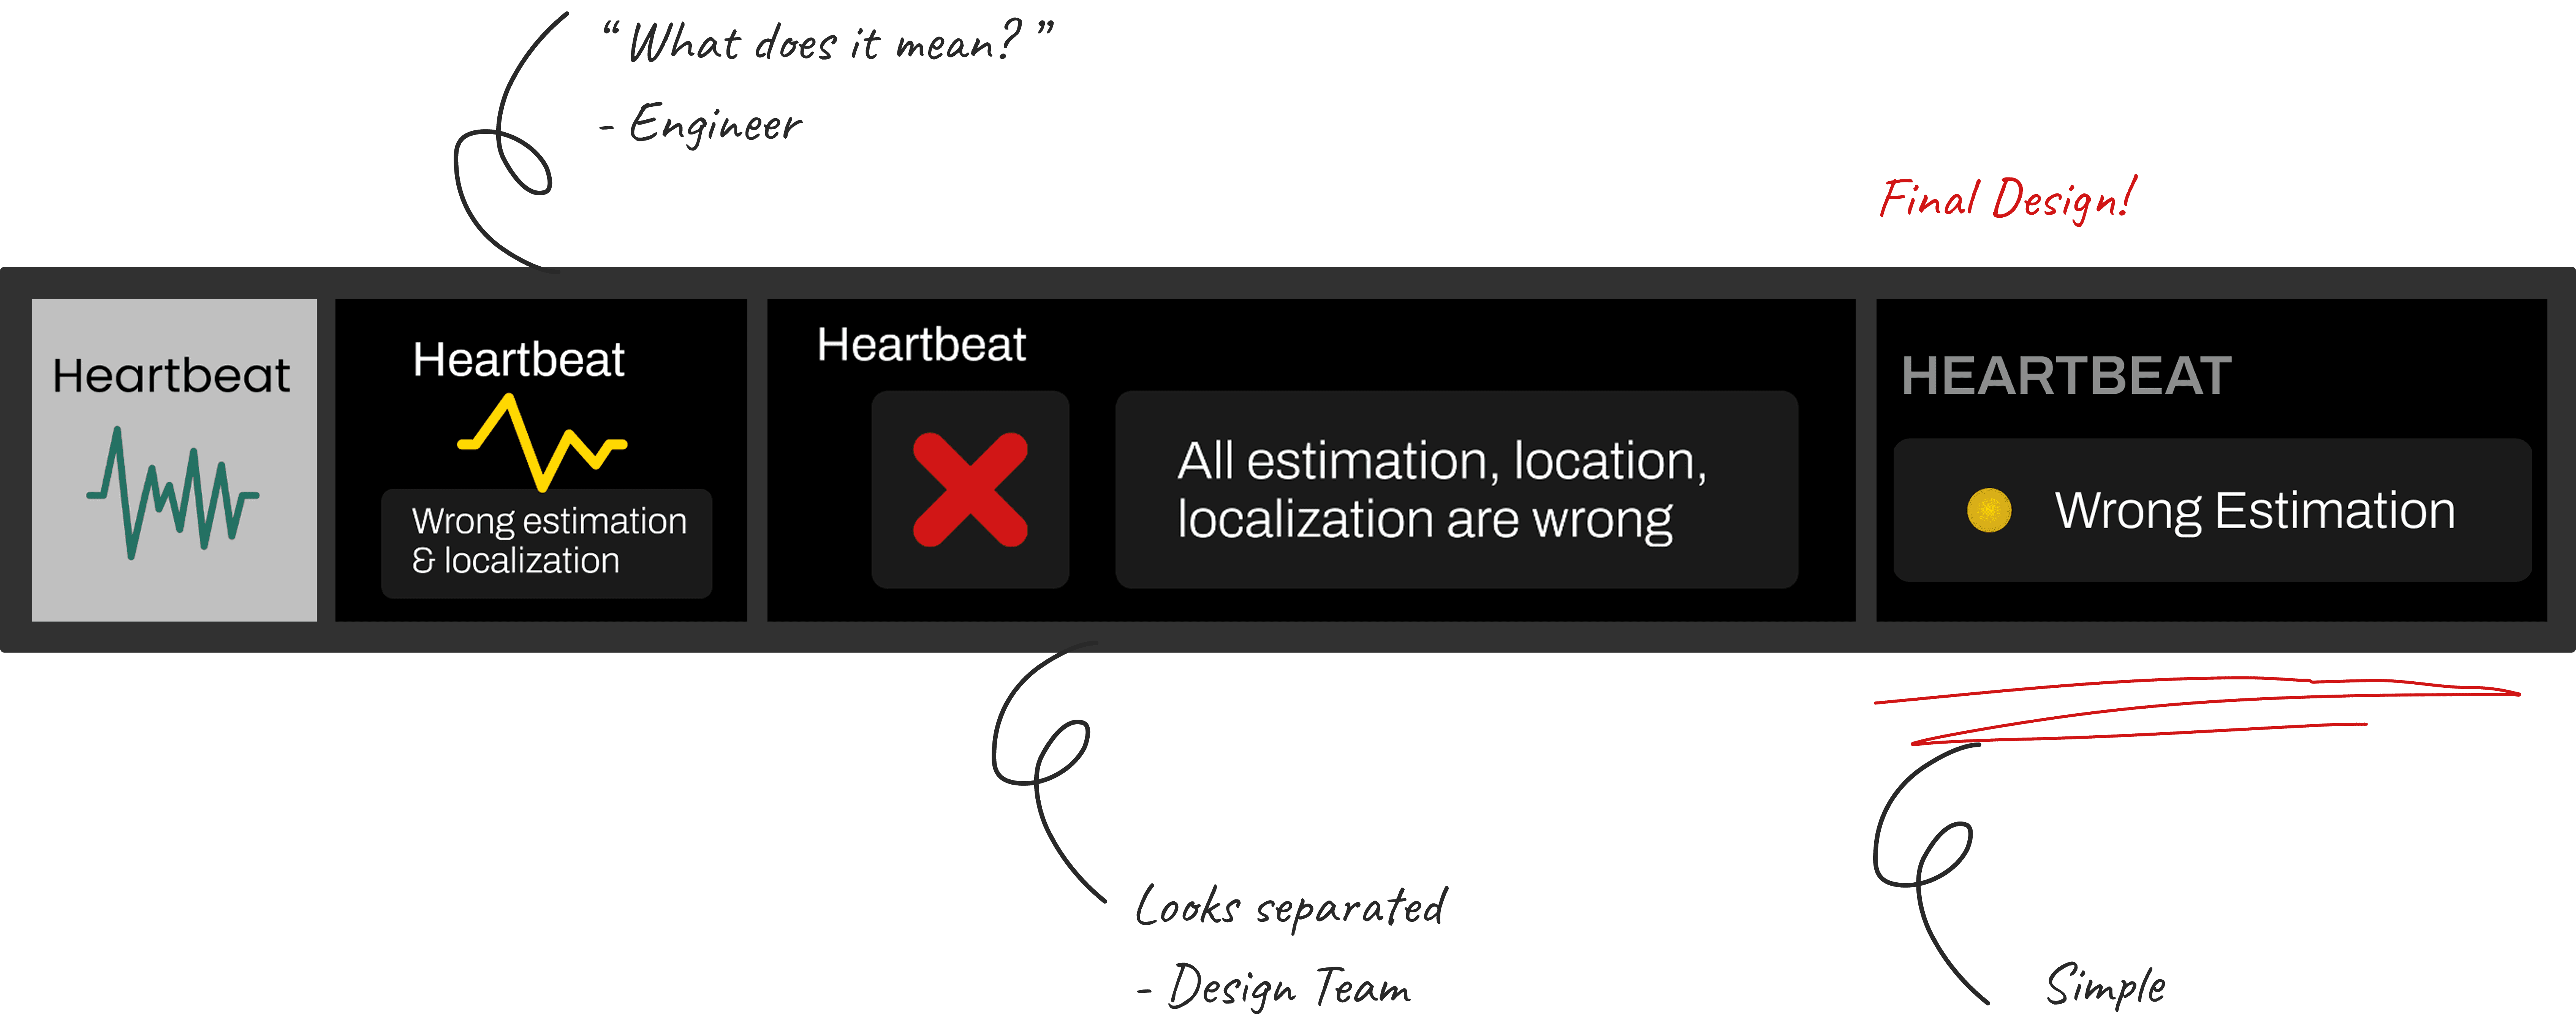
Simplified the visualization of complicated data types

Grouped data based on what each engineering team frequently monitors, so they can focus only on the relevant sections of the dashboard
Before
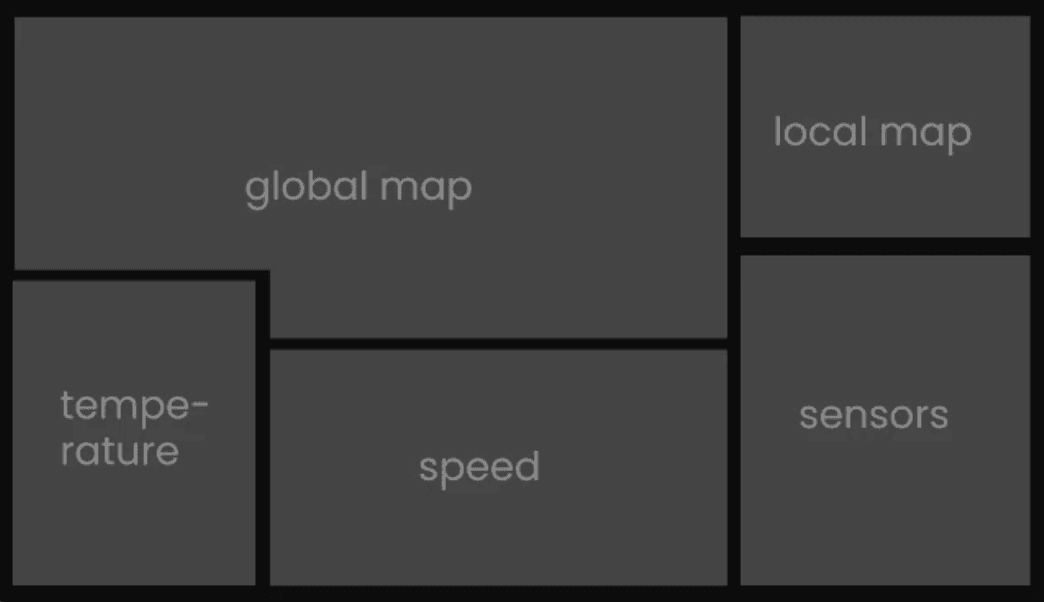

After

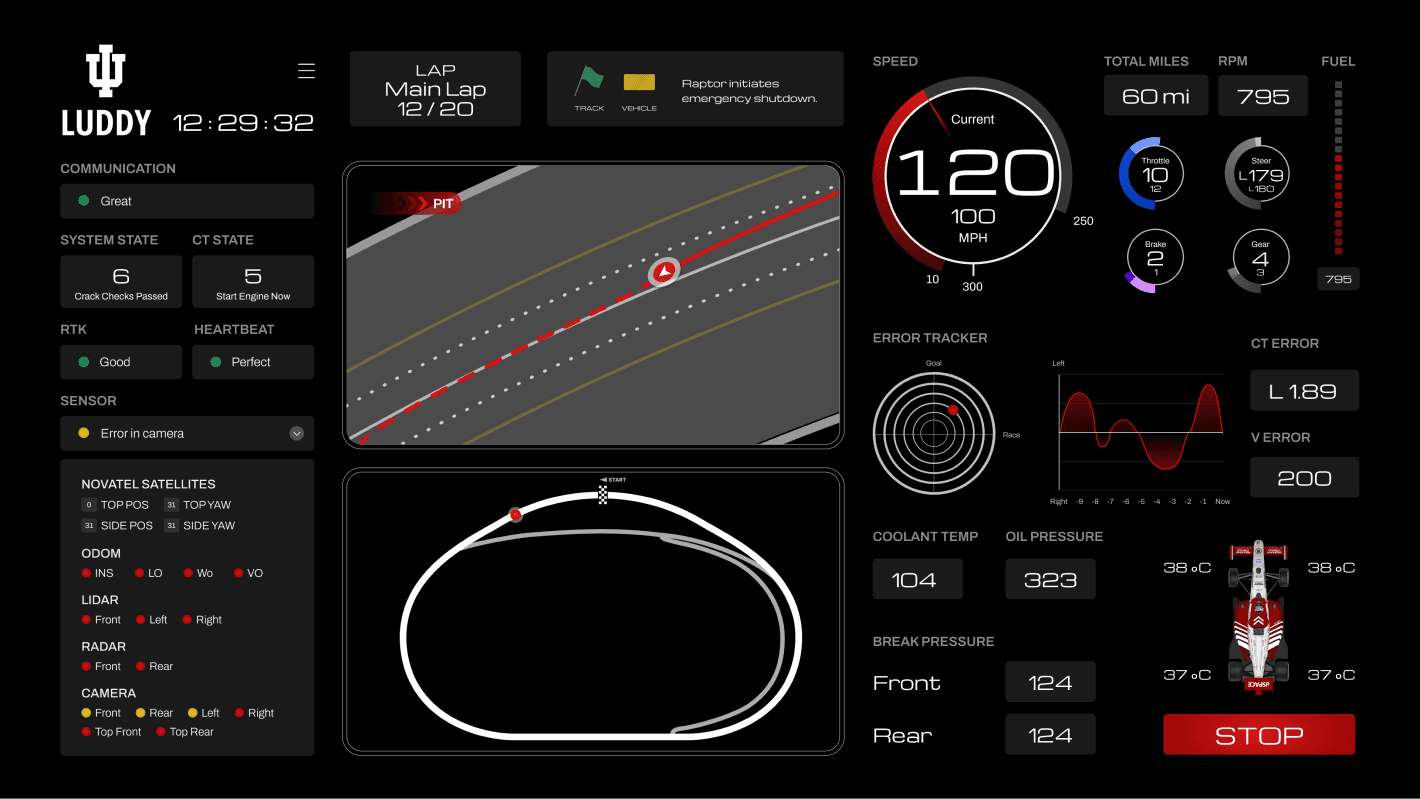
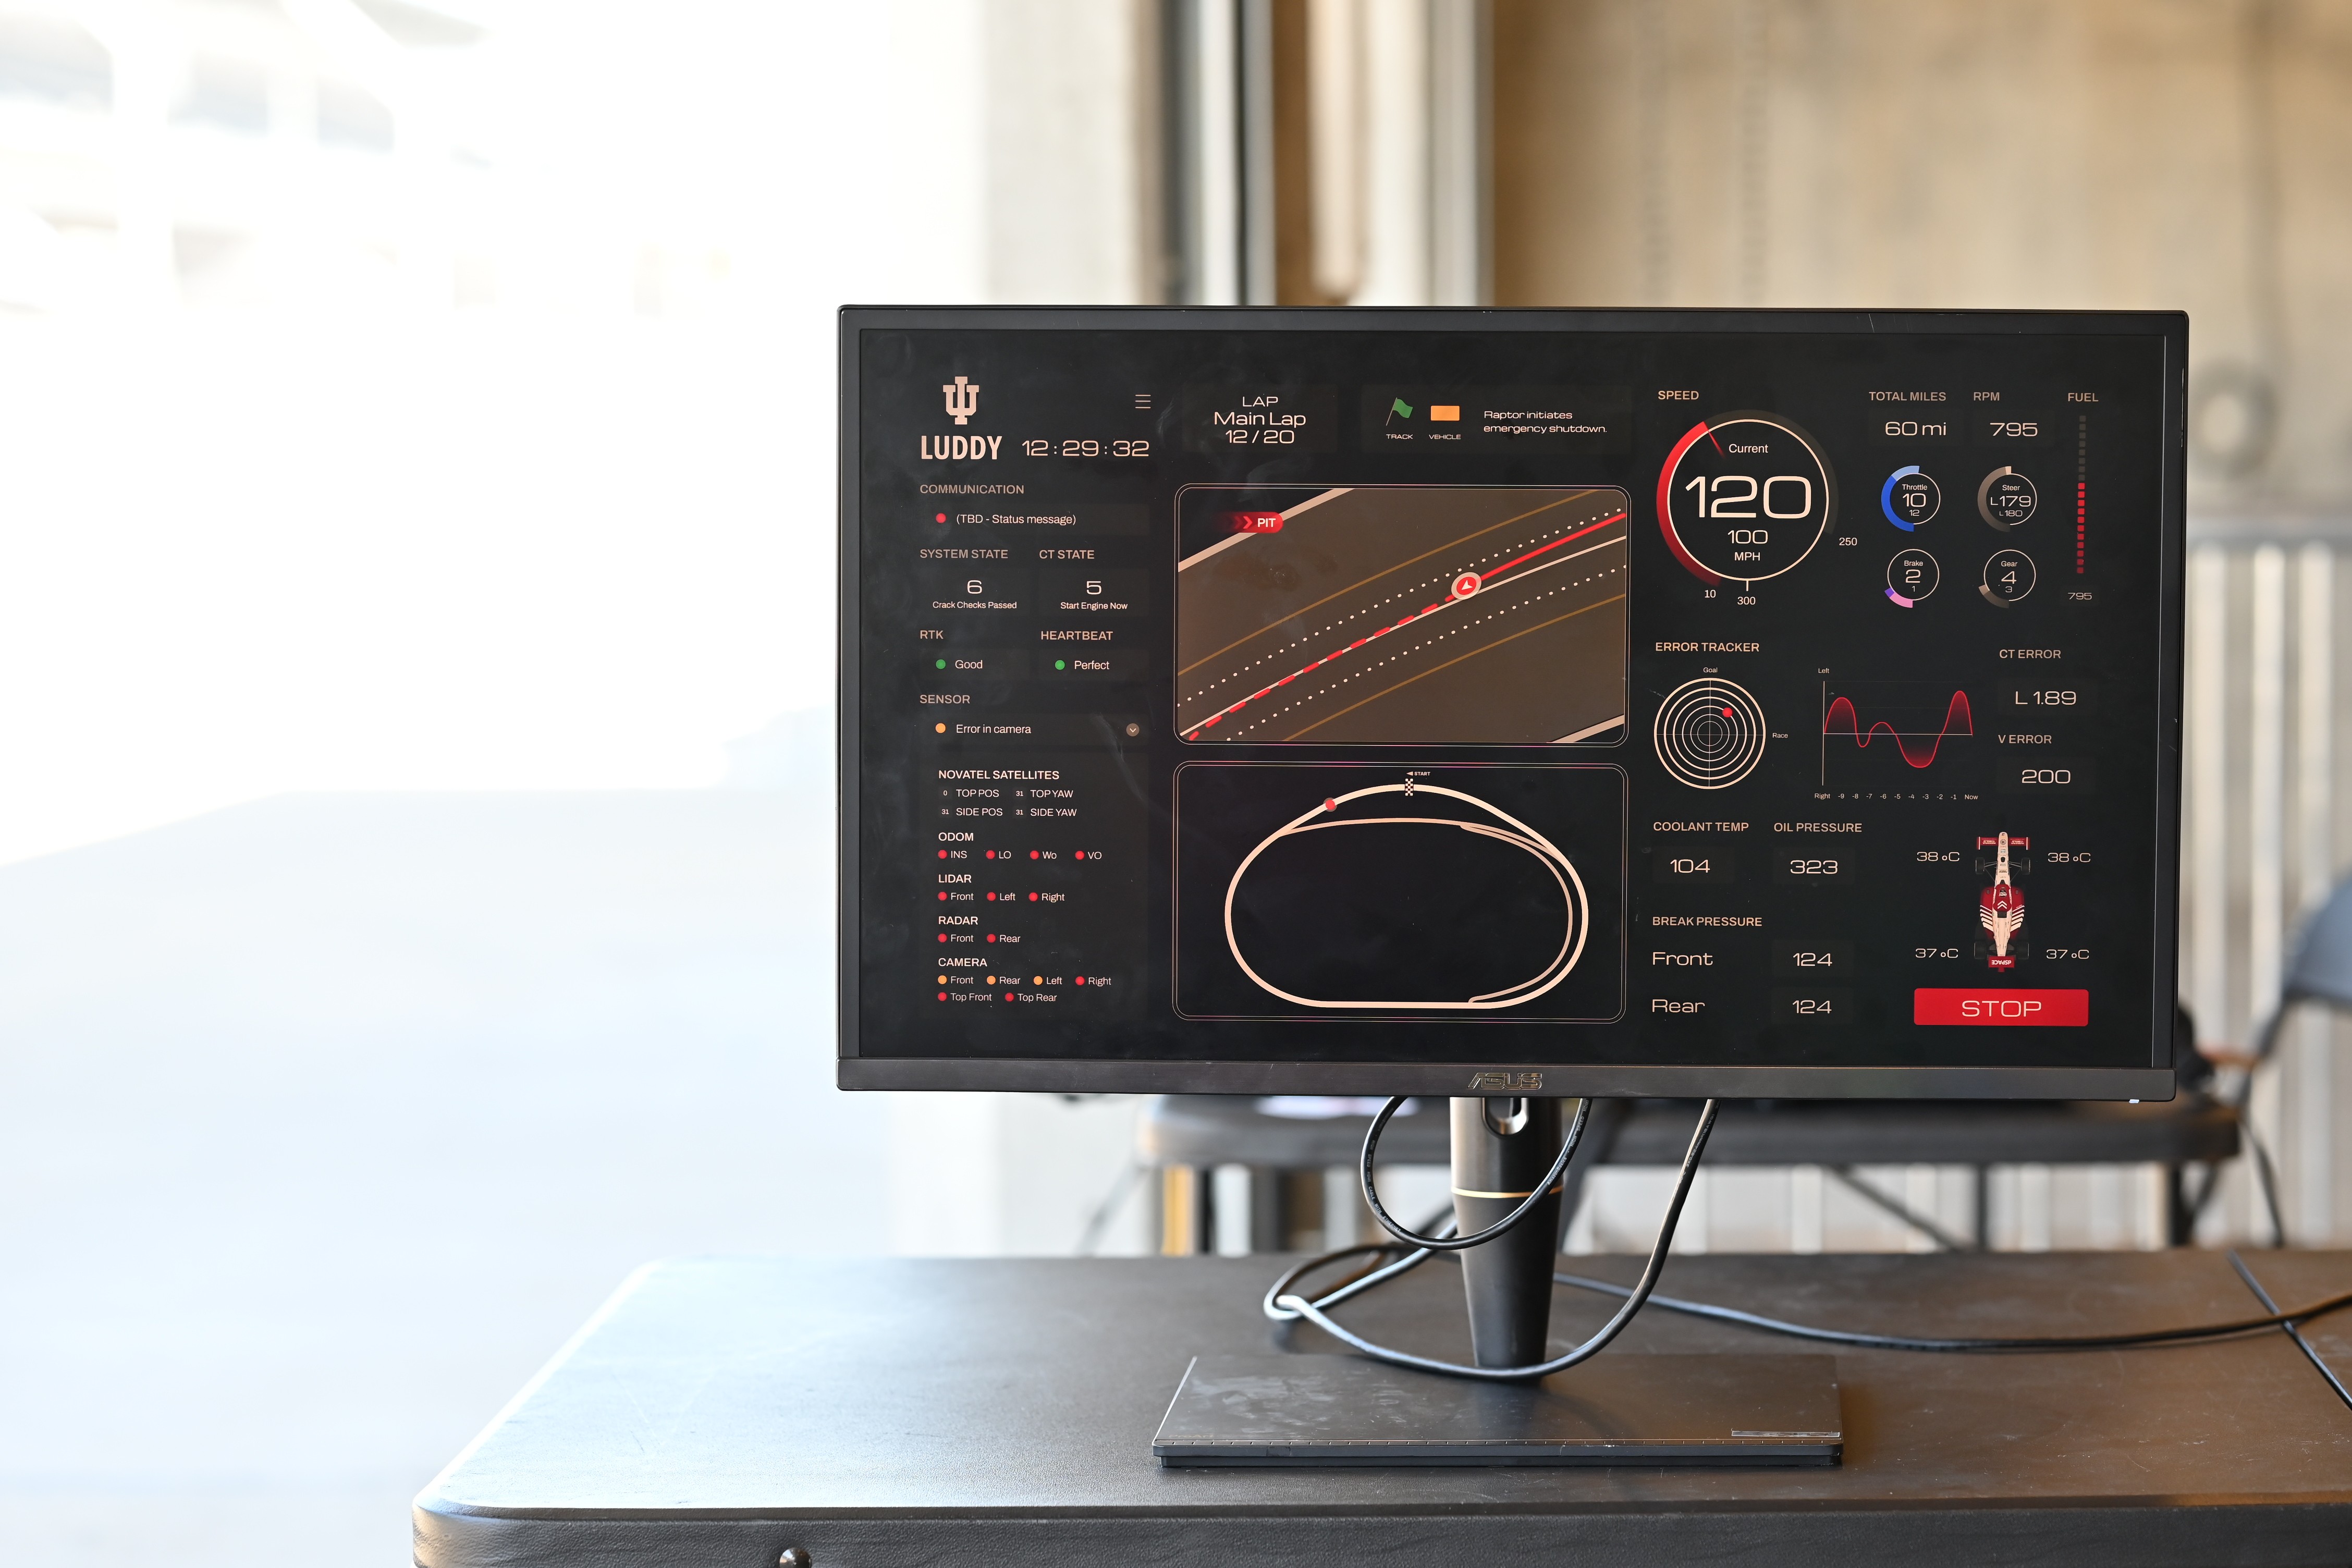
Final Design
Intuitive dashboard showing AI data effectively

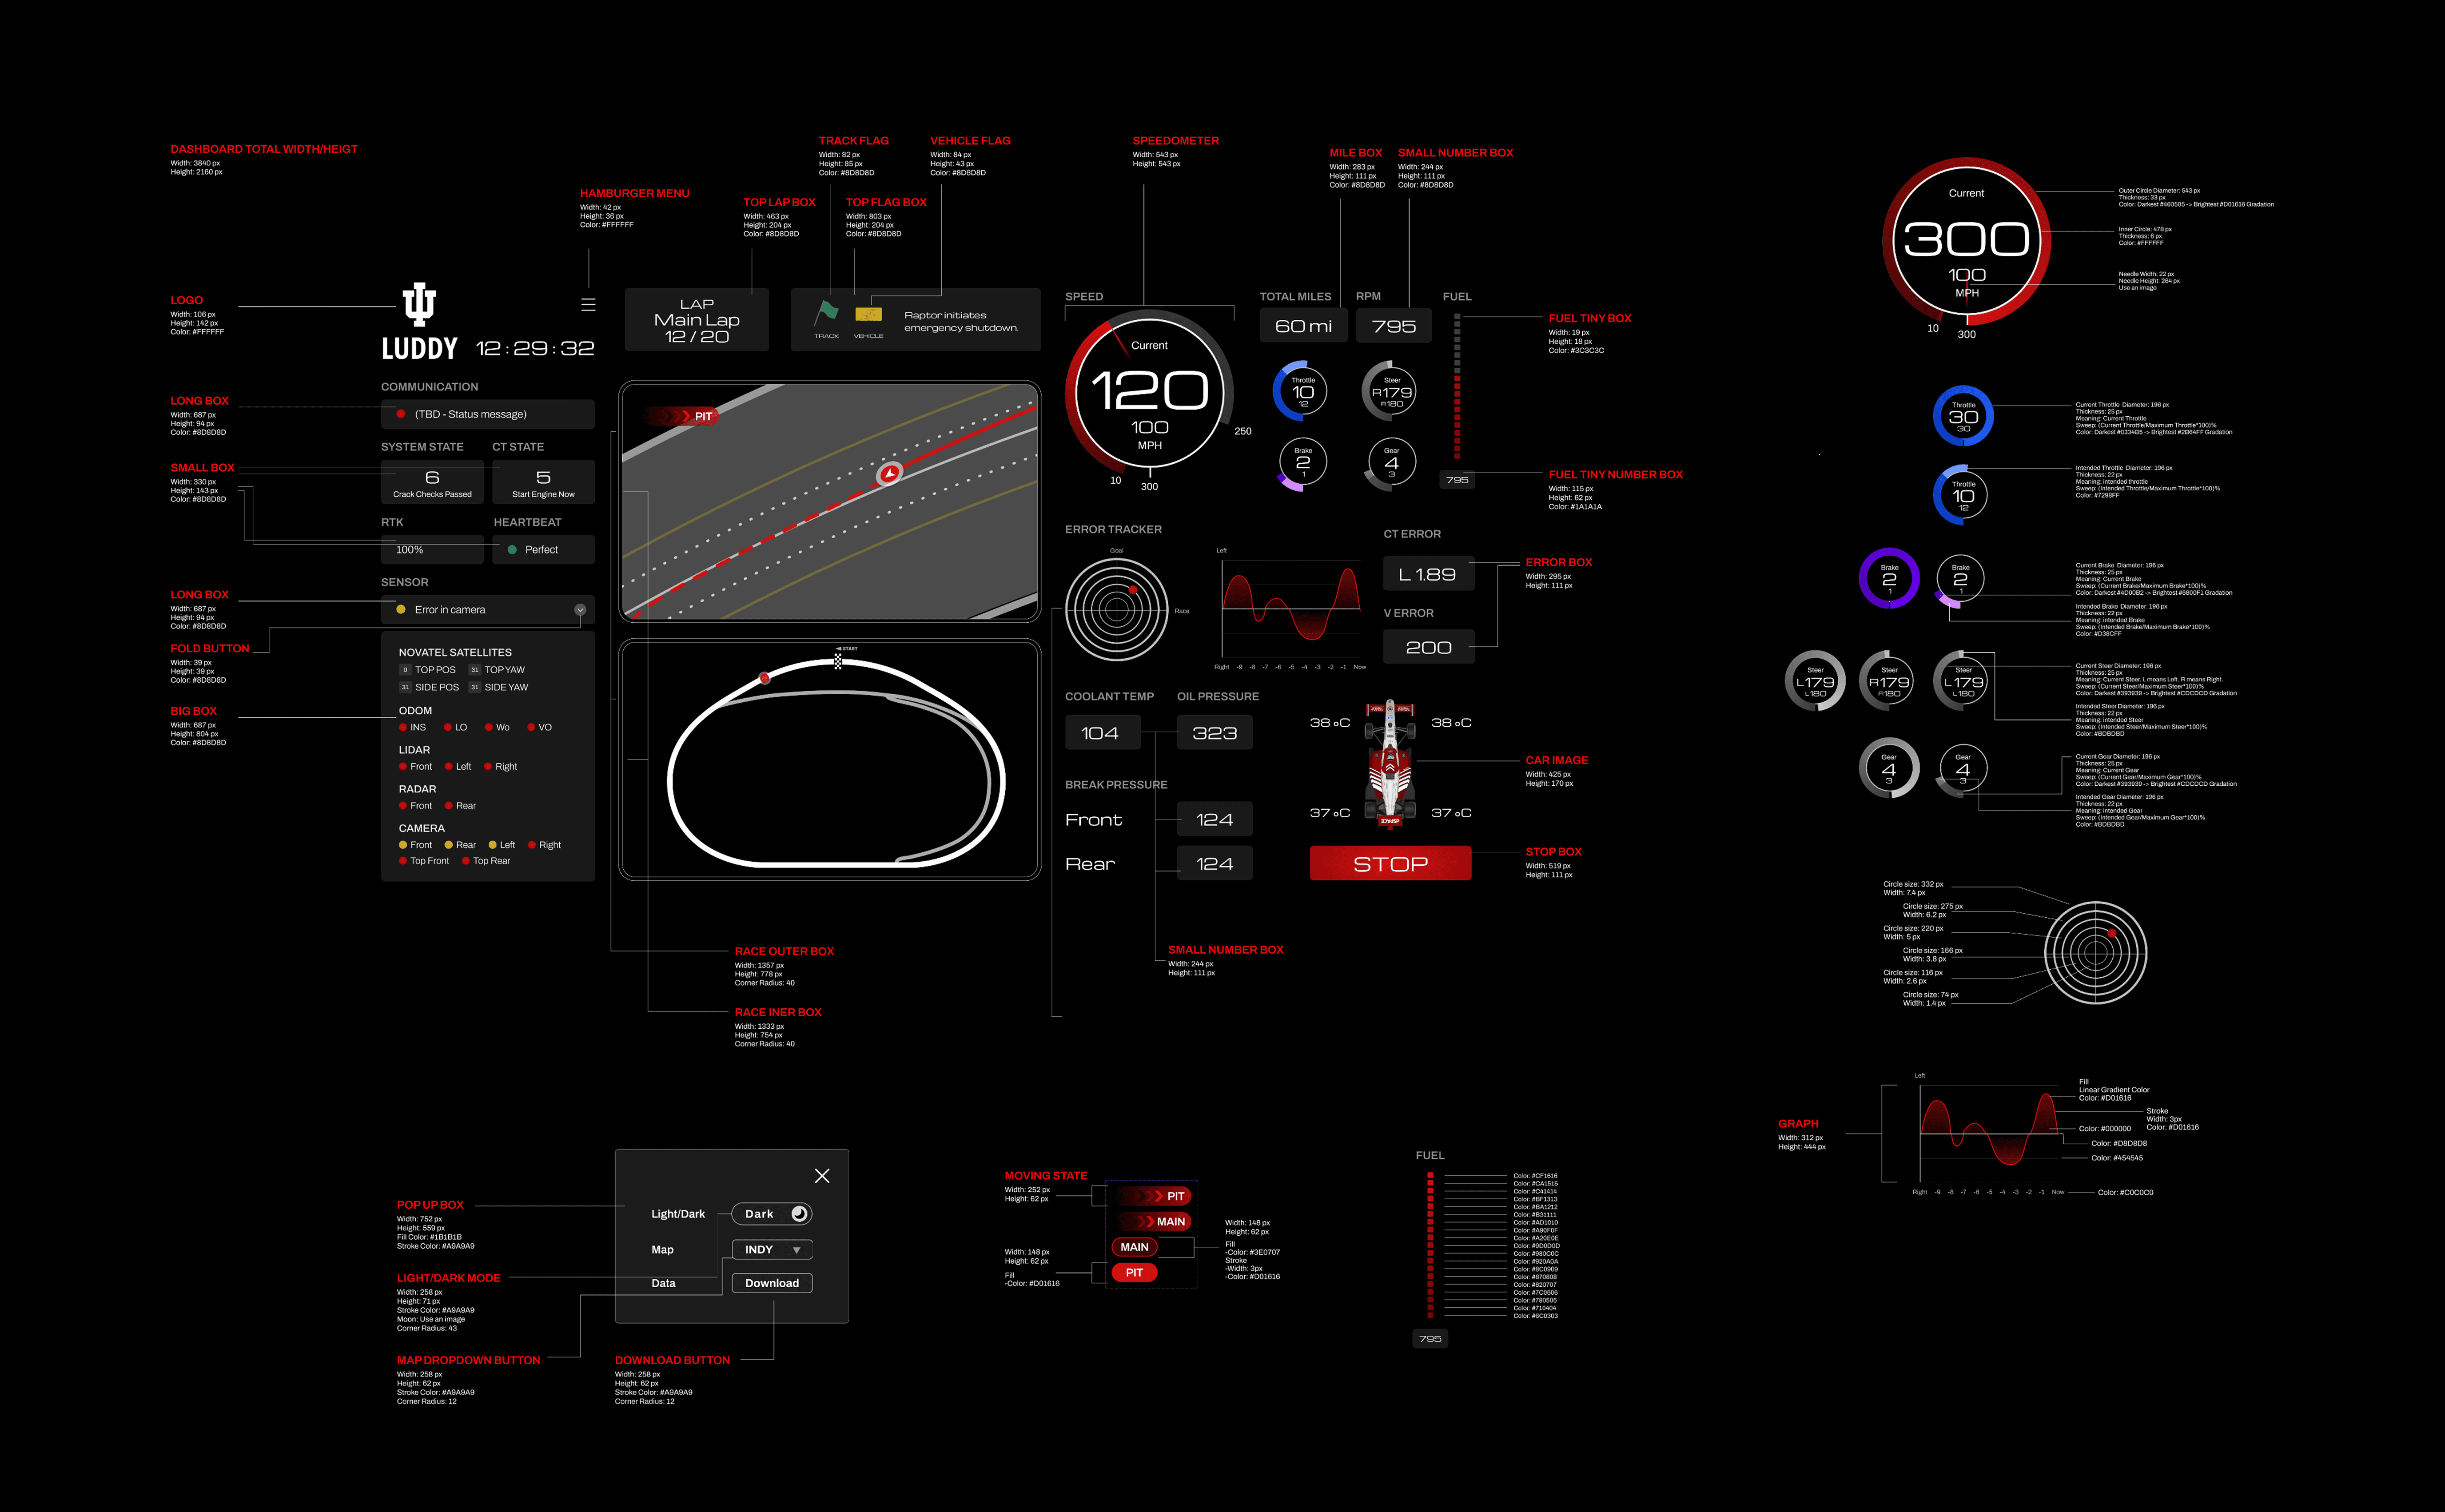
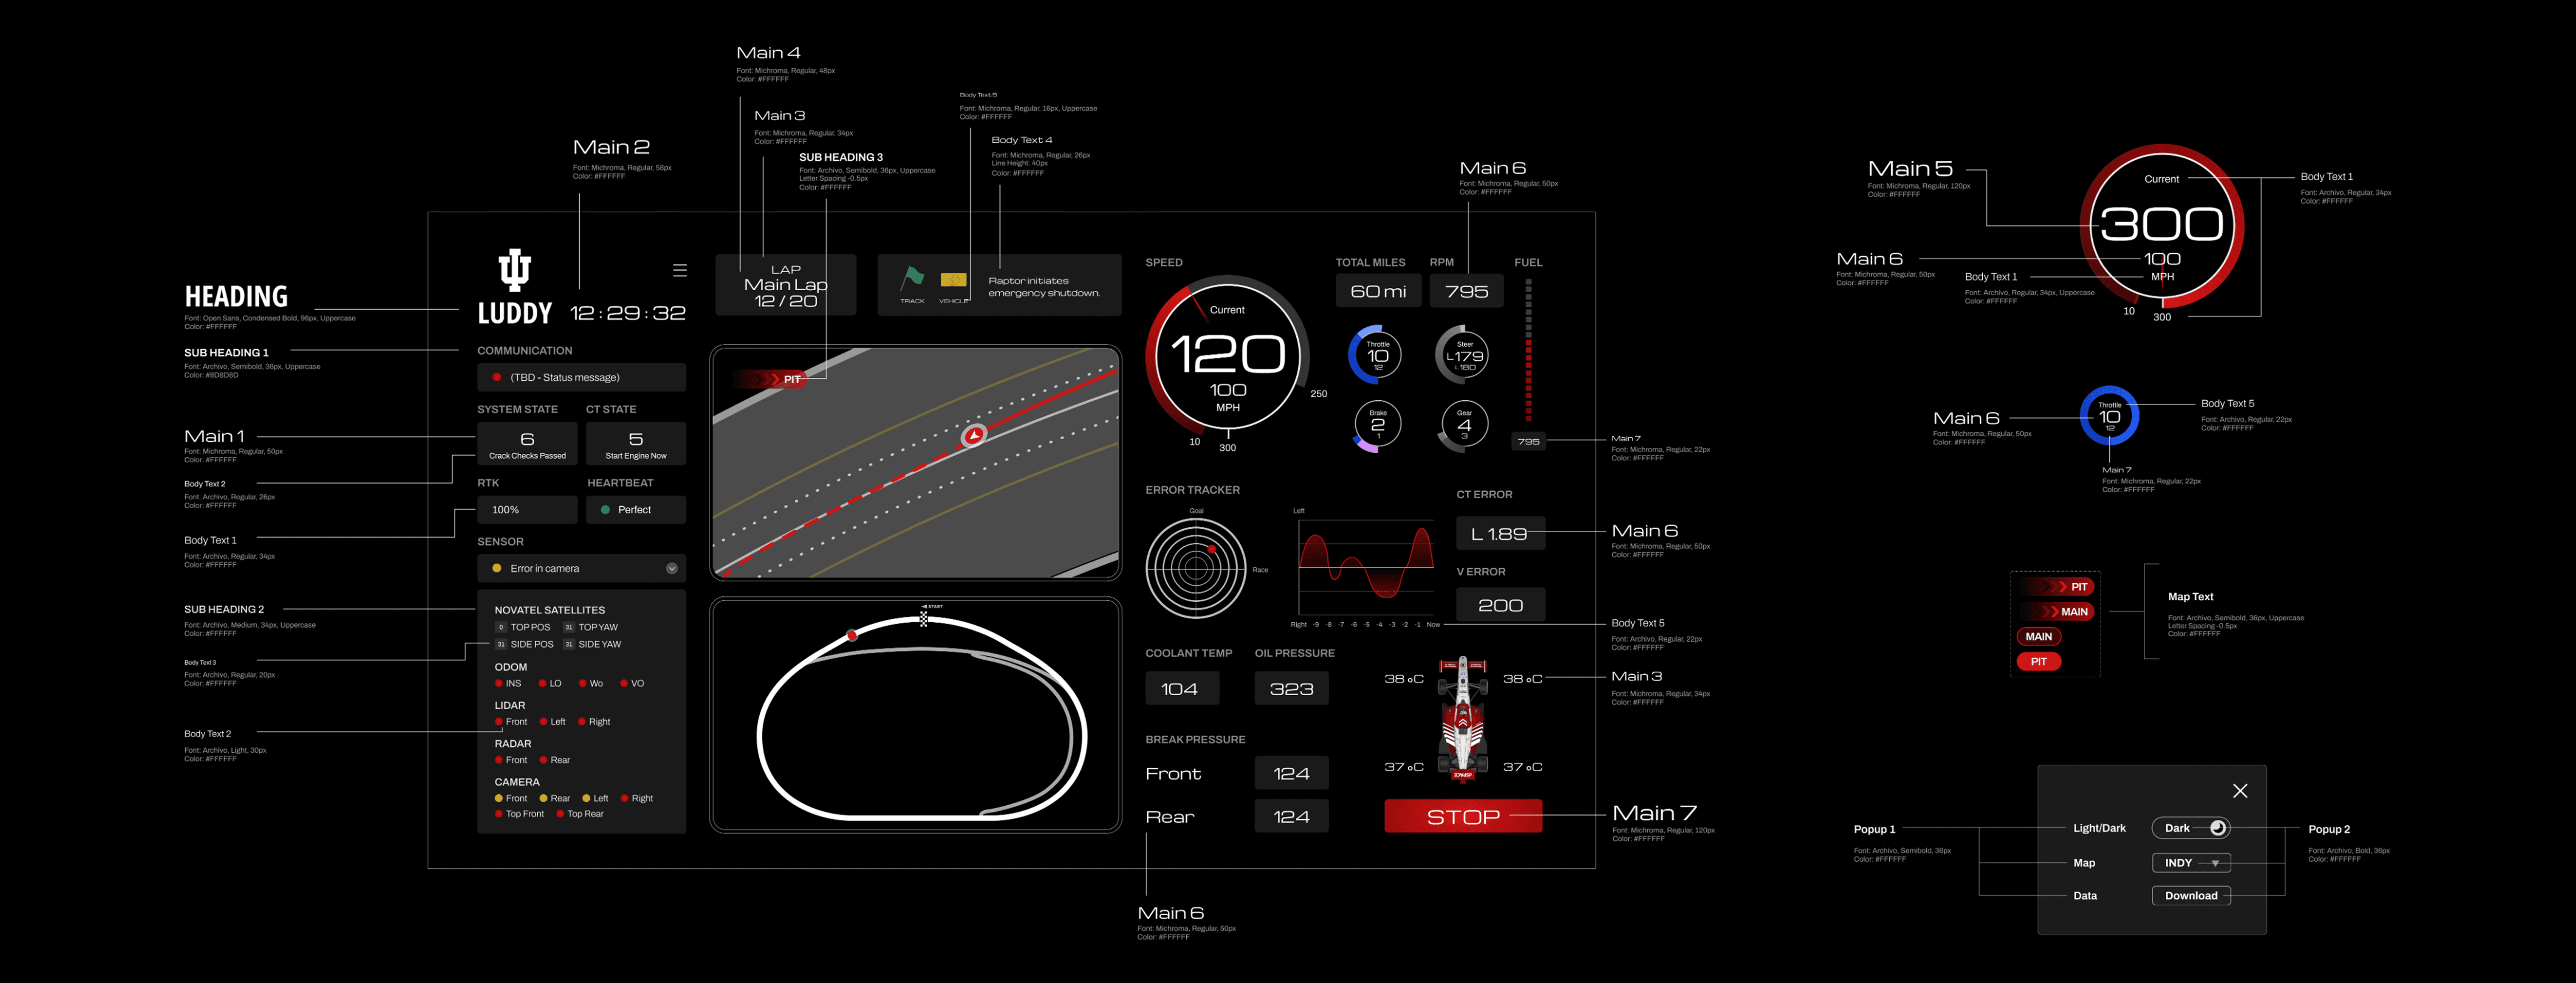
Style Guideline
To support development, I documented variables, data values, and style guides.

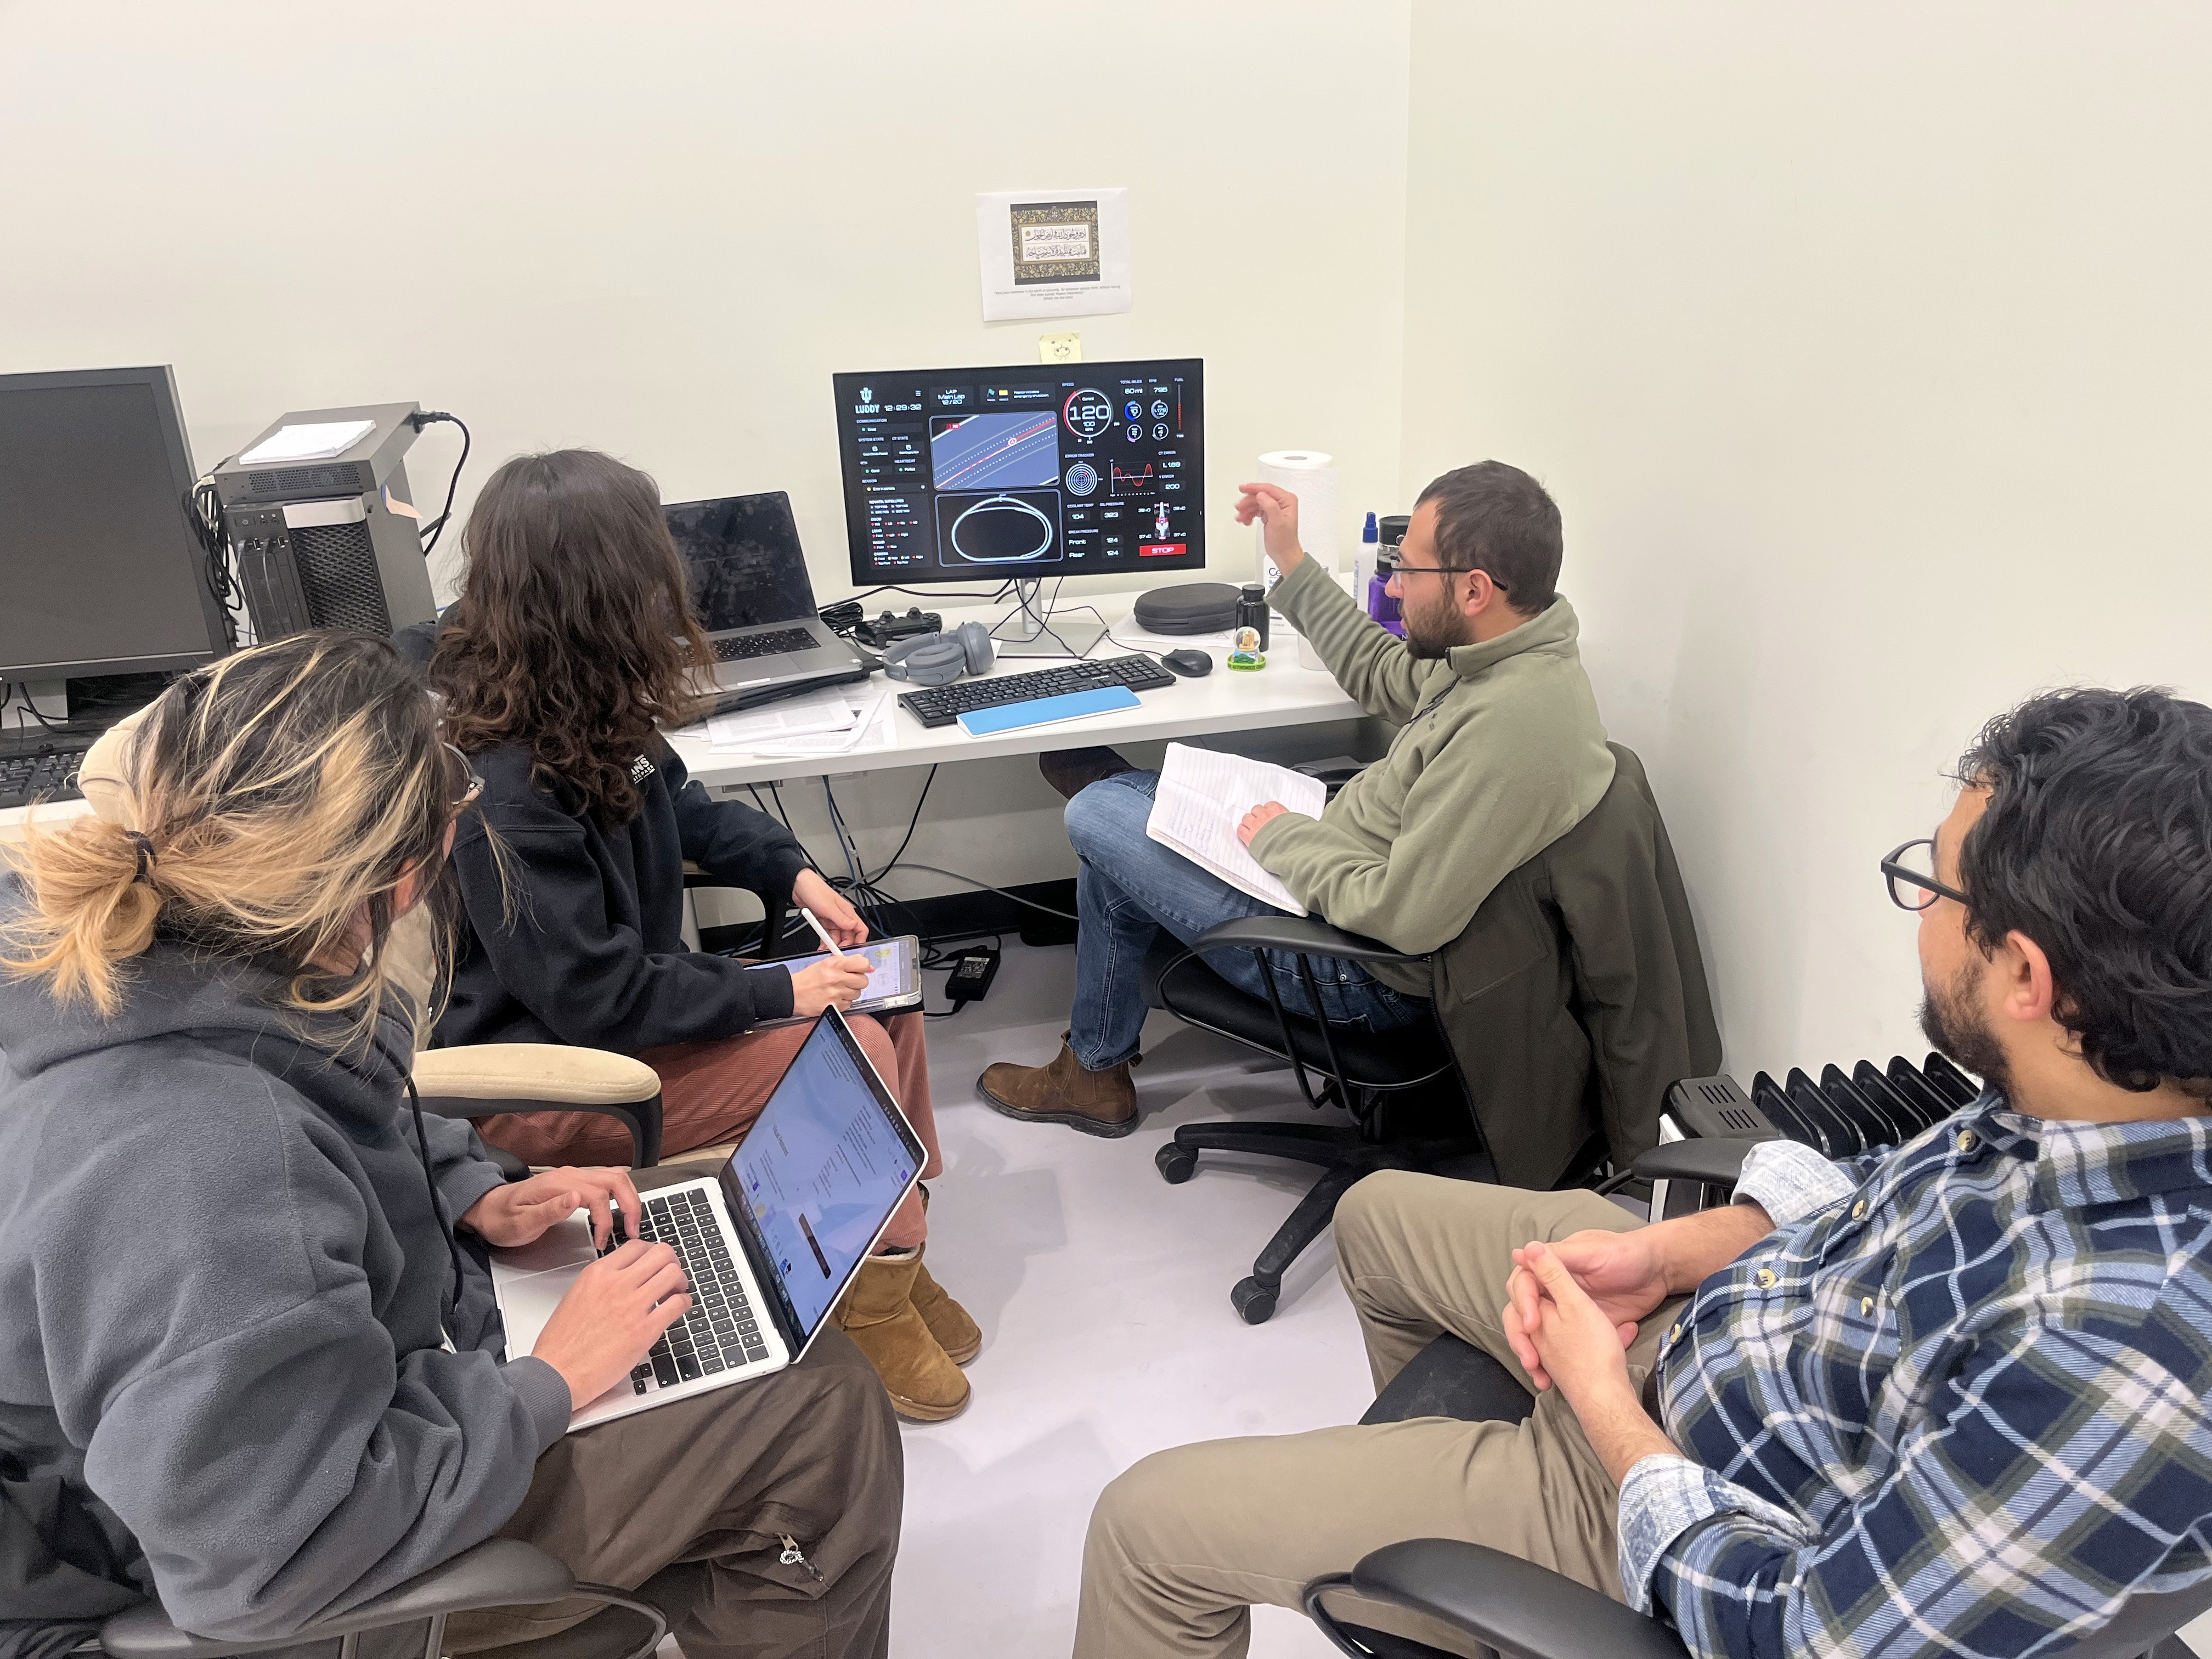
User Testing
User evaluation for feedback

Accessibility check under direct sunlight

Impact
Reduced time for new engineers to locate and understand AI data
3.8 secs
3.8 secs
→➔➜
→
1.2 secs
1.2 secs
Successfully handed off to developers
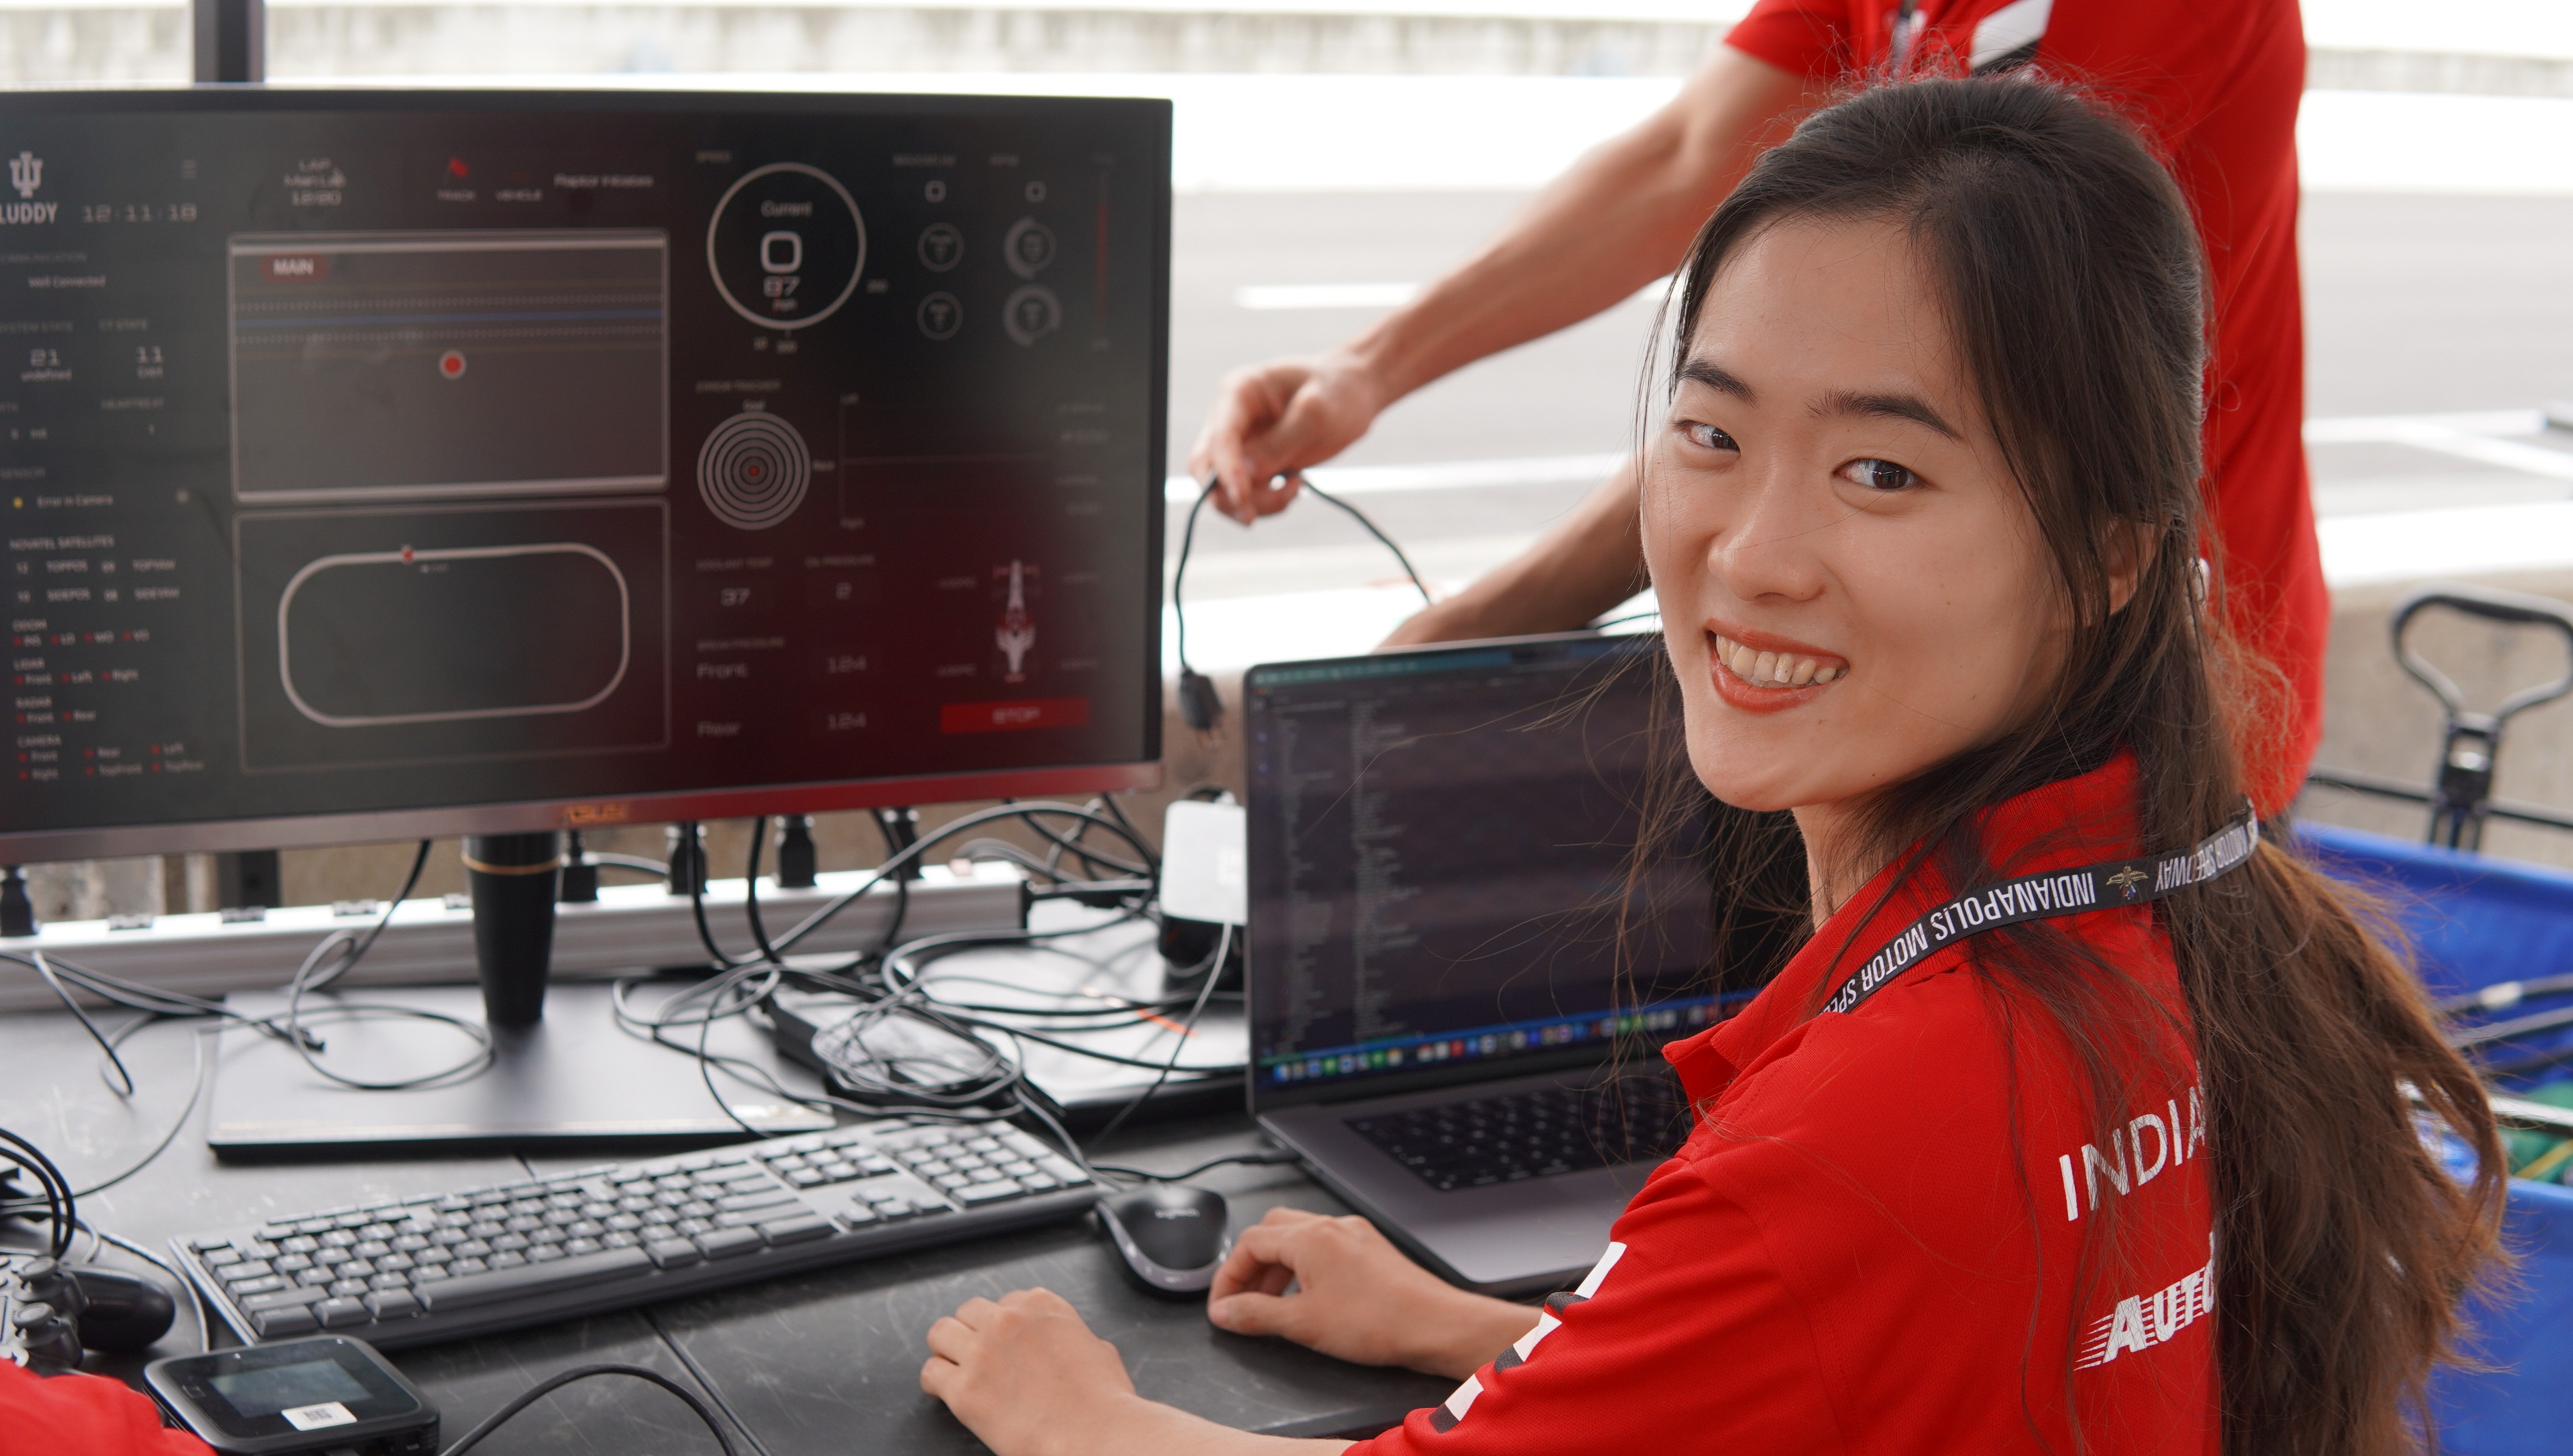

Showcased in the Indy Autonomous Challenge 2024, broadcasted on CNBC
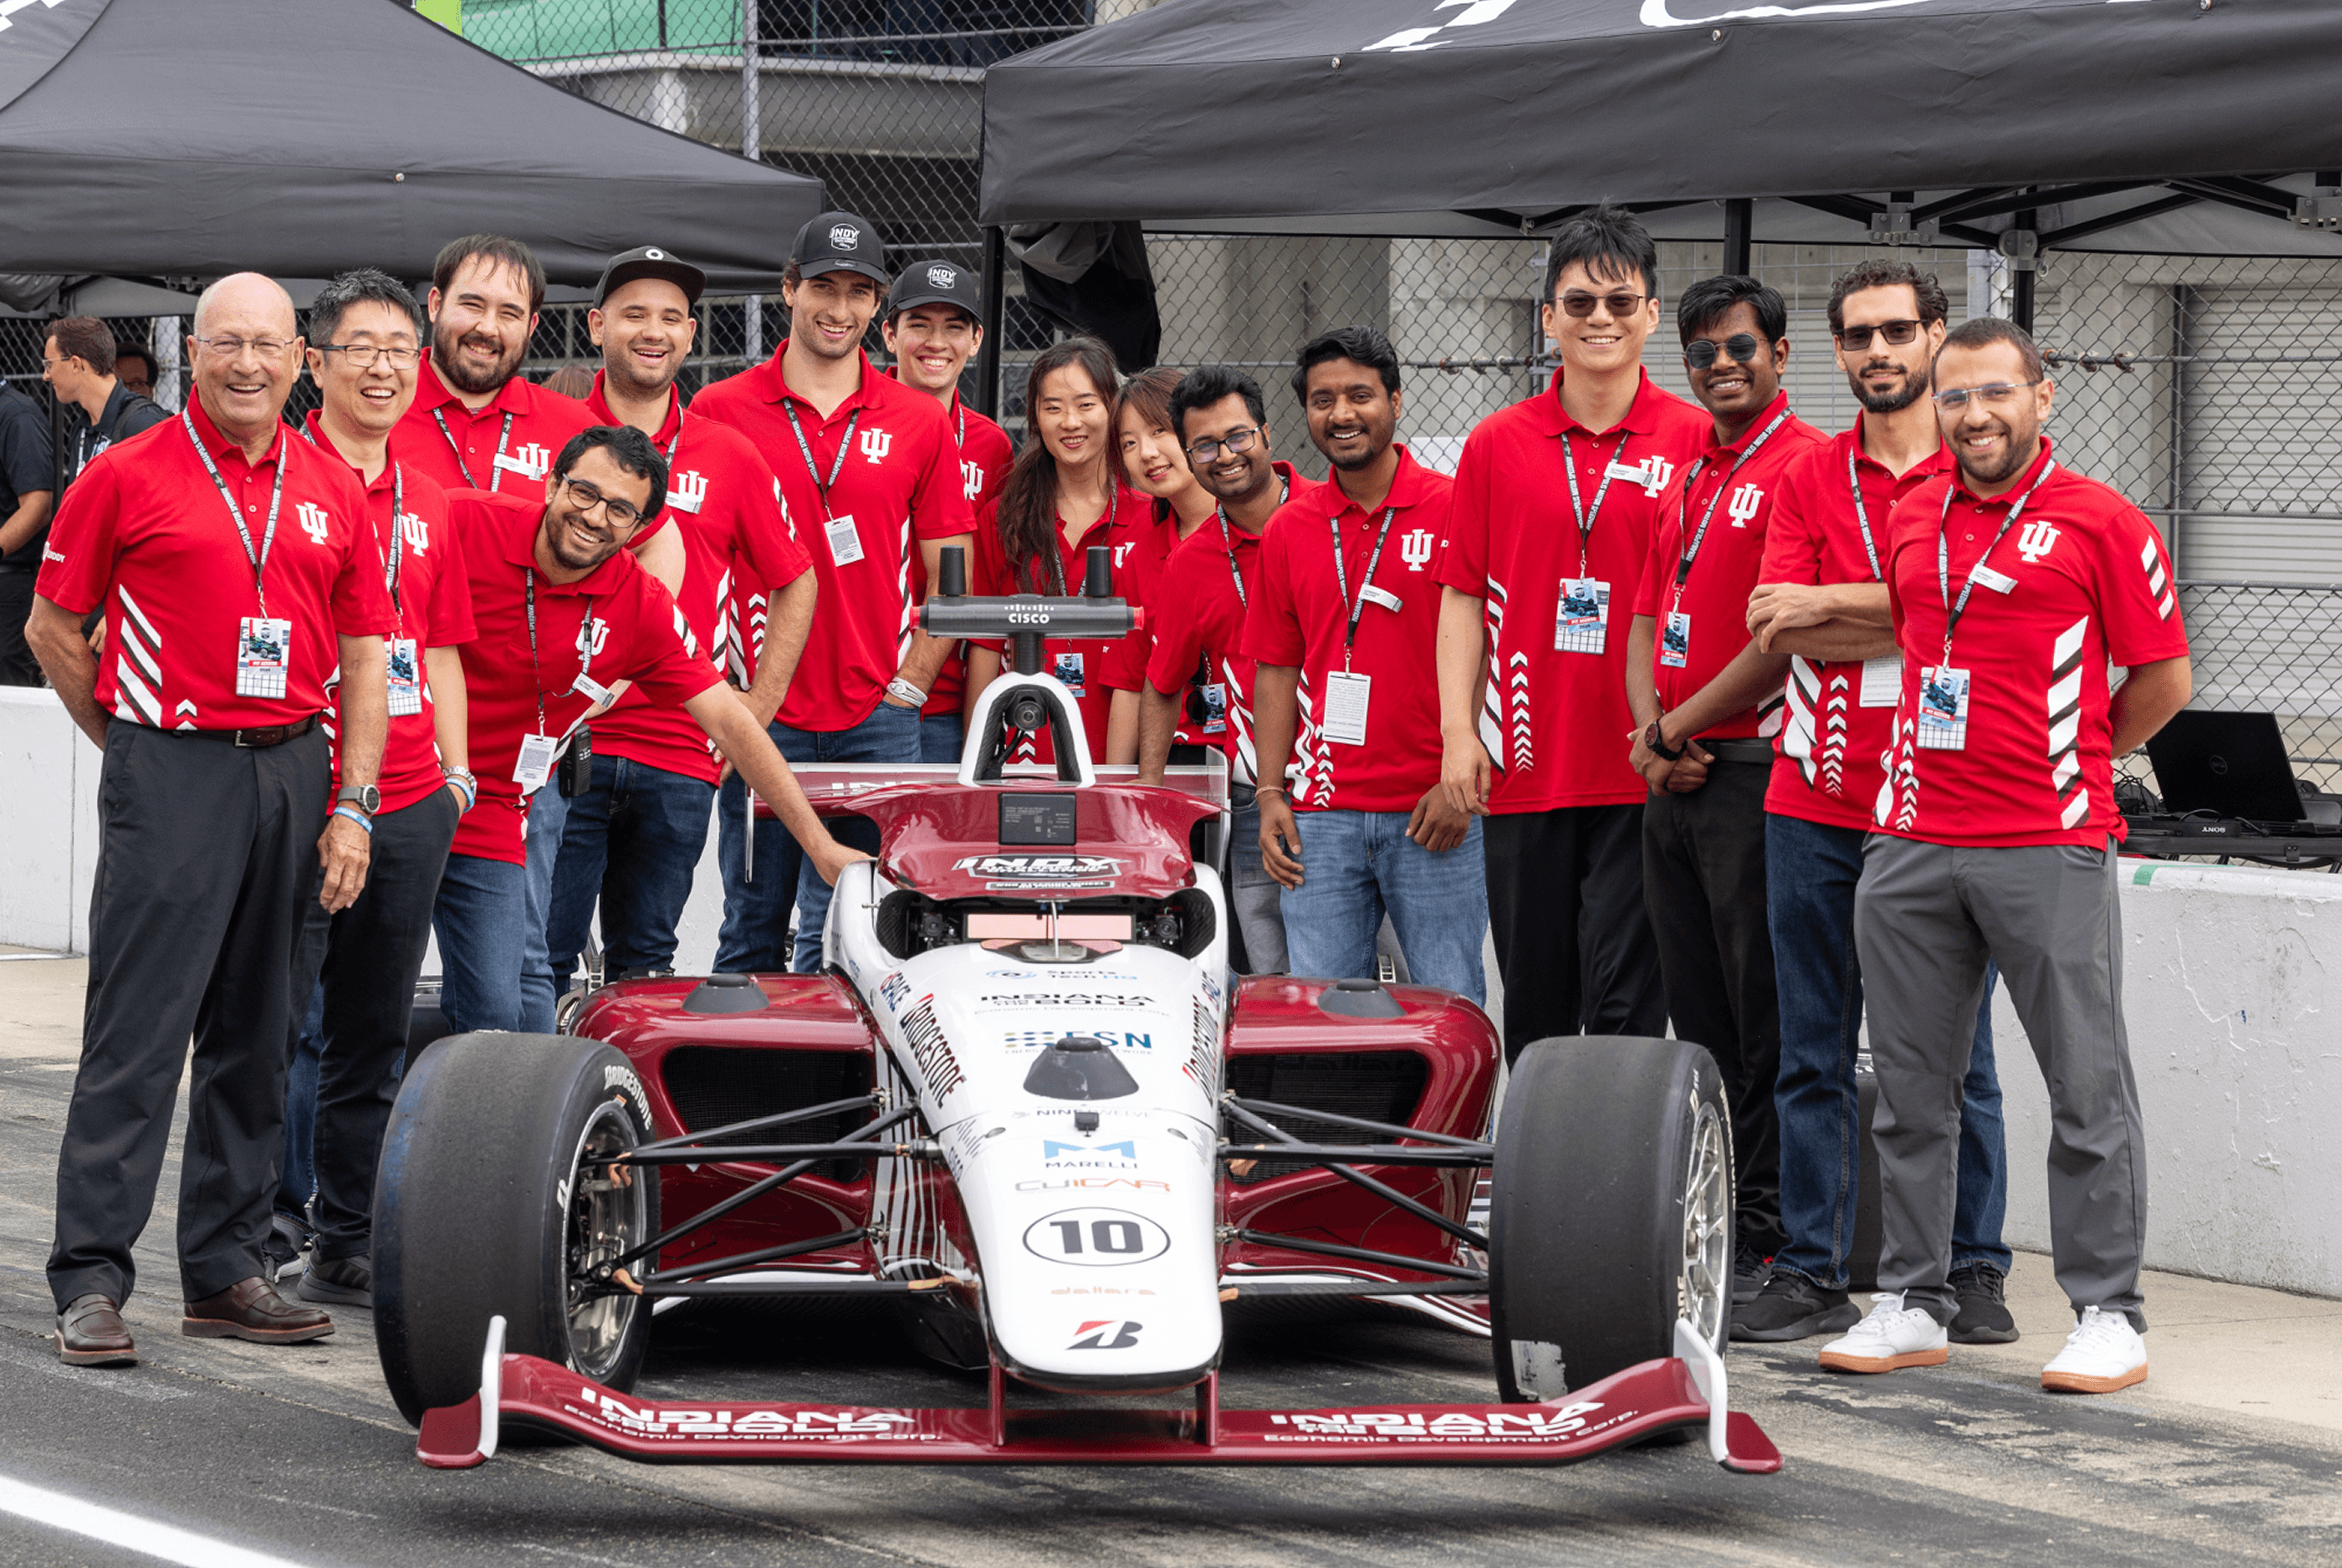


Takeaway
Takeaway
Building an internal tool requires a proactive attitude and friendly relationships with engineers
Building an internal tool requires a proactive attitude and friendly relationships with engineers
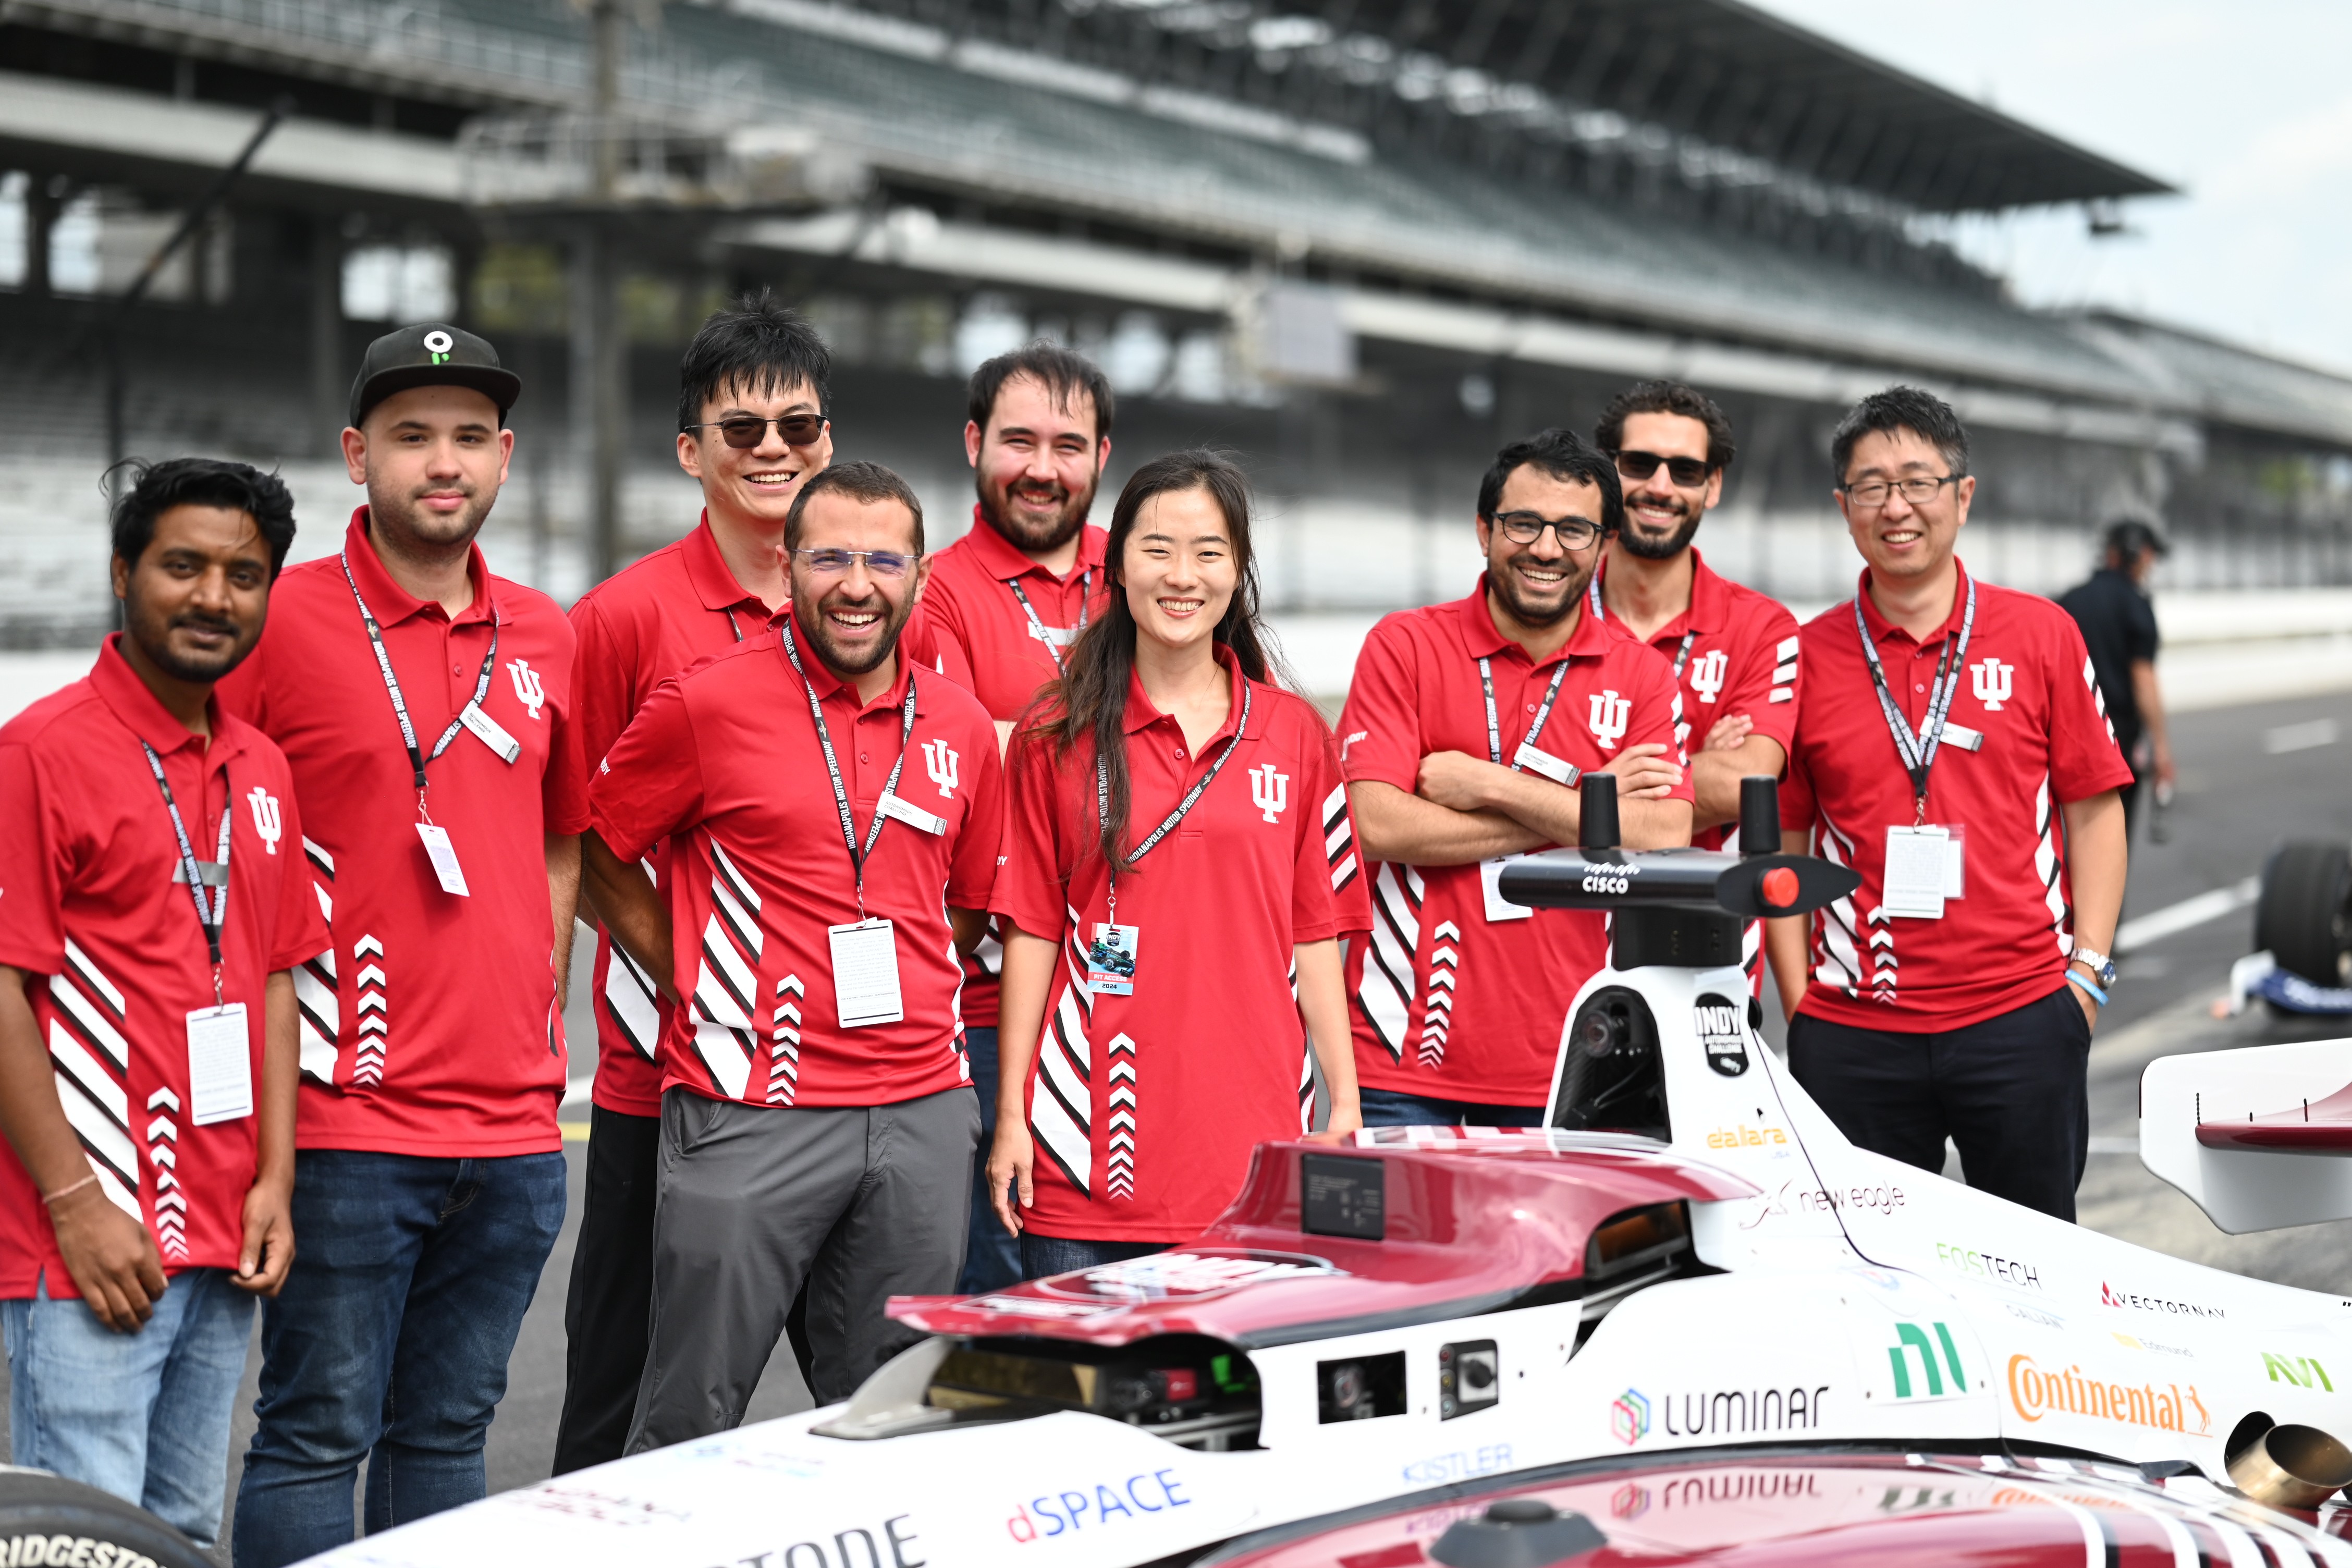

Empathy is essential when creating unprecedented AI products
Empathy is essential when creating unprecedented AI products
Previous Project
Next Project
For the full experience,please switch to desktop. It looks way better there!


